DevOps, Big Data, and Social Media

Kan Tang, Worldwide CTO - HPE Software
Services, Hewlett Packard Enterprise
People today have already stopped talking about DevOps and are now doing DevOps. We have seen a growing number of our customers implementing Enterprise Agility and DevOps practice. So what are the top questions that enterprise customers - especially those enterprises with higher maturity in their DevOps practice, are for more than two years. We adopted Agile and deployed a lot of automation. We have some KPIs to measure service quality, such as requirement coverage ratio and successful deployment rate; and to measure service velocity, such as speed and frequency of deployment. Now, even though we can deliver our features in an agile way with great quality, the question remains: How do we know if we have actually created business value? The system can be perfect, but no one buys our products. We need to know why!”
At the London DevOps Summit 2016, one customer asked an interesting question: “We keep telling our developers to improve their design and implementation as we’ve received a lot of complaints from customer support and the help desk. But our developers really haven’t improved much, as the comments were generic and not actionable. It would be really nice to leverage social media to understand user sentiment about the features we’ve implemented, making the data actionable!”
We frequently ask our customers what percentage of features is being used by the users in production. Most of time, the answer is: “We don’t really know.” A comparison by Hewlett Packard Enterprise (HPE) between the tests it ran and what users were doing with its Application Lifecycle Management (ALM) product revealed some interesting stats. The August 2016 Forrester Research report by Kurt Bittner, Diego Lo Giudice, and Robert Stroud, Build The Right Software Better And Faster With Agile And DevOps Metrics, reported that when HPE compared user tests it ran on its ALM product, there was only a 35% overlap (see Figure 1) between features tested and features used. This meant that the product team didn't understand 65% of what users did with the tool, and it was testing a lot of behavior that didn't reflect what users did. This insight became the impetus for a major push to better understand customers, which has in turn resulted in significant shifts in how and where HPE makes its investments. Knowing what features users are actually using and whether that functionality is actually useful—helps organizations form a more complete picture of the customer's experience. This information helps us fine-tune our investment decisions, reducing waste and shifting resources to capabilities that drive greater business value and better customer experience.

Figure 1: Low Overlap Between Features Tested And Features Used Means Devs Need Better Customer Insight (Authorized use by Forrester for this post)
Several customers believed that business lead time is one of the most important metrics in DevOps practice. Lead time measures how long it takes for a first set of features to be developed and delivered into production after the request has been entered into the portfolio management system. It directly impacts business and business planning. For example, if the lead time is a month, then organizations would have a much greater sense of urgency to handle new requests. Knowing the lead time will help organizations with much better planning and efficiency.
In my previous post, I shared with you our Release 2 KPIs. In this new release, we are moving to more advanced KPI metrics related to customer and business values using big data, as well as social media with both structured and unstructured data. Here are a few KPIs to consider:
Feature Usage
The HPE Software Advantage app includes a web app, a mobile app, and backend services. We automated our DevOps pipeline tool-chain to build this app from planning, design, coding, security scanning, build, deploy, testing, and monitoring—all the way to production. We continuously improve this application by understanding user insight using big data engines and social media feedback.

Figure 2: HPE Advantage app for DevOps DemonstrationThis KPI dashboard (Figure 3) shows how often a feature is being used and the overall percentage of usage in each release.
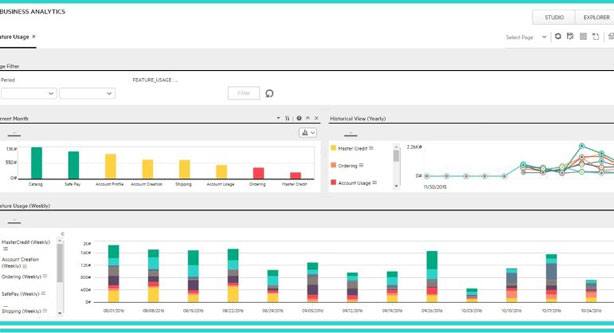
Figure 3: An example of an HPE Software solution dashboard for Feature Usage
Feature Sentiment
Feature usage measures the frequency of the usage of the features; a lower overall usage shows less efficiency in the requirement management process. Feature sentiment shows positive, negative, mixed, or neutral expression by the users about the features and applications. It provides direct feedback from users to the business requirement, design, and development teams.
In this release, we use Twitter as our social media input channel. The tweets are being collected in real time by our HPE big data engine IDOL server through the Twitter connector. The data are then analyzed through IDOL’s sentiment analysis module to output sentiment expression. Data can be further cleansed and categorized. We applied fuzzy match for the data correlation.
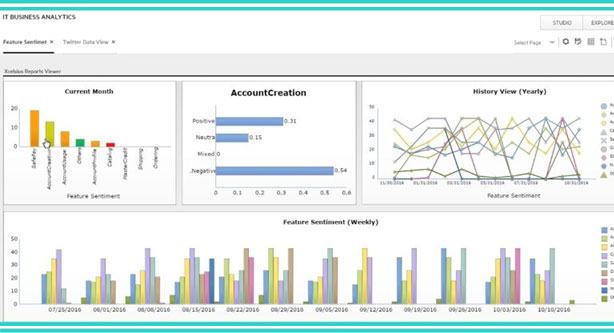
Figure 4: An example of an HPE Software solution dashboard for Feature Sentiment
Lead time/Cycle time
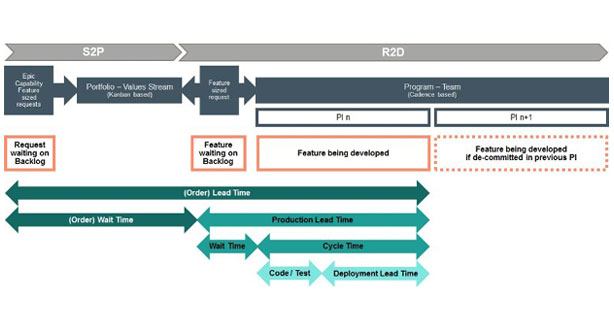
There are several lead times including order lead time, production lead time, cycle time, and deployment lead time, as illustrated in Figure 5.
Lead time is important because it predicts:
•Effectiveness of your automated testing in the deployment pipeline
•Ability to quickly deploy into production without causing chaos and disruption
•Ability to detect and correct problems through monitoring
•Effectiveness of Dev and Ops to work together
•How quickly developers can get feedback on their work
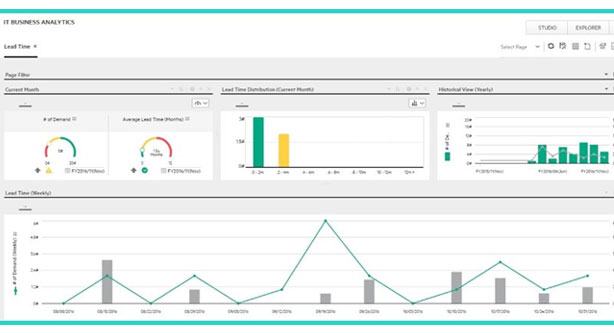
Figure 6: An example of an HPE Software solution dashboard for Lead Time
What’s next?
If you’re still not sure about the importance of DevOps KPI metrics, here are some recommendations from Gartner (Authorized use by Gartner for this post):Seven Steps to Start Your DevOps Initiative by David Paul Williams and George Spafford, February 2016: In a DevOps initiative, the objectives must be at the team level and aligned to the end goal — business enablement via faster production release. Metrics must be aligned accordingly based on the objectives set for the team.How to Scale DevOps Beyond the Pilot Stage by Cameron Haight, March 2015, Foundational September 2016: Do not forget about metrics. DevOps organizations are data-driven organizations. While code is the source of truth in that it tells you whatDevOps is doing, metrics tells you how DevOps is doing.When DevOps is integrated with Big Data and social media, it becomes very powerful as it creates actionable insights to improve customer and business values. If you want to learn more about our advanced KPIs, please join us at Discover 2016 London and visit the DevOps demo booth #DEMO624 or reach out to one of our experts from Software Services Strategy & Solutions.
Subscribe to Industry Era
News
An AI built a boutique with $100,000, then panicked when no one showed up to work
Tribally owned gas stations offer cheaper fuel as Iran war drives up prices
'The plan is working': Trump's trade chief brushes off economic fears in Rust Belt tour
‘America’s Not OK’: Surveys Show US Wellbeing in Steep Decline Under Trump
The Postal Service Is in Trouble. Here’s How It Could Affect Your Mail.
PS6 Pricing: 41% of Digital Foundry Viewers Would Pay $699 or More for a Next-Gen PlayStation
ShinyHunters Claims Rockstar Games Snowflake Breach via Anodot
Samsung Continues Expanding One UI 8.5 Beta Program to More Galaxy Devices
Hackers meet their match: New DNA encryption protects engineered cells from within
A Closer Look at Sabrina Carpenter’s Custom 2026 Coachella Looks